by COWBERRY

6 minute read
Quinoa vs rice: nutrition, calories and which one to choose

Quinoa vs rice is not a fight with one winner: quinoa takes the nutrition column with 13.11 g of protein and 14.66 g of fibre per 100 g, rice takes the kitchen column, and the glycemic index ends nearly level. This page sets the two grains side by side, per 100 g and per katori; for rice on its own, see our rice (chawal) guide.
Quinoa vs rice: the verdict in three lines
Three lines cover the whole comparison:
- Quinoa wins the nutrition column: more protein, much more fibre and more minerals per 100 g.
- Rice wins the plate: it is the grain Indian kitchens already cook, it costs less, and India-tested basmati holds a GI of 50, just under quinoa's 52.
- For weight loss the serving math is nearly a tie, 132 versus 143 kcal a katori, so pick by the day: rice daily, quinoa as the protein-rich swap.
Quinoa vs rice nutrition: per 100 g side by side
The table compares the raw grains per 100 g, from IFCT 2017. The two columns that decide most quinoa-versus-rice debates sit in the first rows: quinoa's 13.11 g of protein per 100 g is 65 percent higher than the 7.94 g in milled white rice, and its 14.66 g of fibre is more than five times white rice's 2.81 g. Brown rice narrows the gap on fibre, at 4.43 g, but stays behind quinoa on protein, at 9.16 g. Calories and carbohydrate go the other way: quinoa carries 329 kcal per 100 g with 53.65 g of carbohydrate, against 357 kcal and 78.24 g for white rice, even though quinoa carries more fat, 5.50 g per 100 g against 0.52 g. Minerals follow the same pattern: quinoa's iron is 7.51 mg per 100 g against white rice's 0.65 mg, and its calcium is 198 mg against 7.49 mg.
| Nutrient | Quinoa (raw) | White rice (IFCT raw milled rice) | Brown rice (raw) |
|---|---|---|---|
| Energy (kcal) | 329 | 357 | 354 |
| Protein (g) | 13 | 7.9 | 9.2 |
| Fat (g) | 5.5 | 0.5 | 1.2 |
| Carbohydrates (g) | 54 | 78 | 75 |
| Dietary fibre (g) | 15 | 2.8 | 4.4 |
| Iron (mg) | 7.5 | 0.7 | 1 |
| Calcium (mg) | 198 | 7.5 | 11 |
| Magnesium (mg) | 119 | 19 | 94 |
| Potassium (mg) | 474 | 108 | 199 |
| Sodium (mg) | 4.5 | 2.3 | 3.6 |
| Zinc (mg) | 3.3 | 1.2 | 1.7 |
| Folate (mcg) | 173 | 9.3 | 12 |
| Glycemic index (GI) | 52 | 50 | 58 |
Per 100 g raw, edible portion. Composition: IFCT 2017 (ICMR-NIN). GI: University of Sydney GI database. — means not reported. These are average values for the food; the label on a pack gives the values for that product.
Quinoa vs rice glycemic index
The tested GI values are closer than the labels usually suggest. Quinoa's three plain cooked entries, all tested in Australia, average 52, inside the low band, while India-tested basmati sits at 50 and brown rice lands at 58 in the medium band. On the University of Sydney scale, low is 55 or below and high is 70 or above, so quinoa and basmati are effectively level, and neither needs a special claim. For the rice side in full detail, the low GI rice guide gives each grain's GI with its country and form.
Quinoa vs rice: taste and cooking
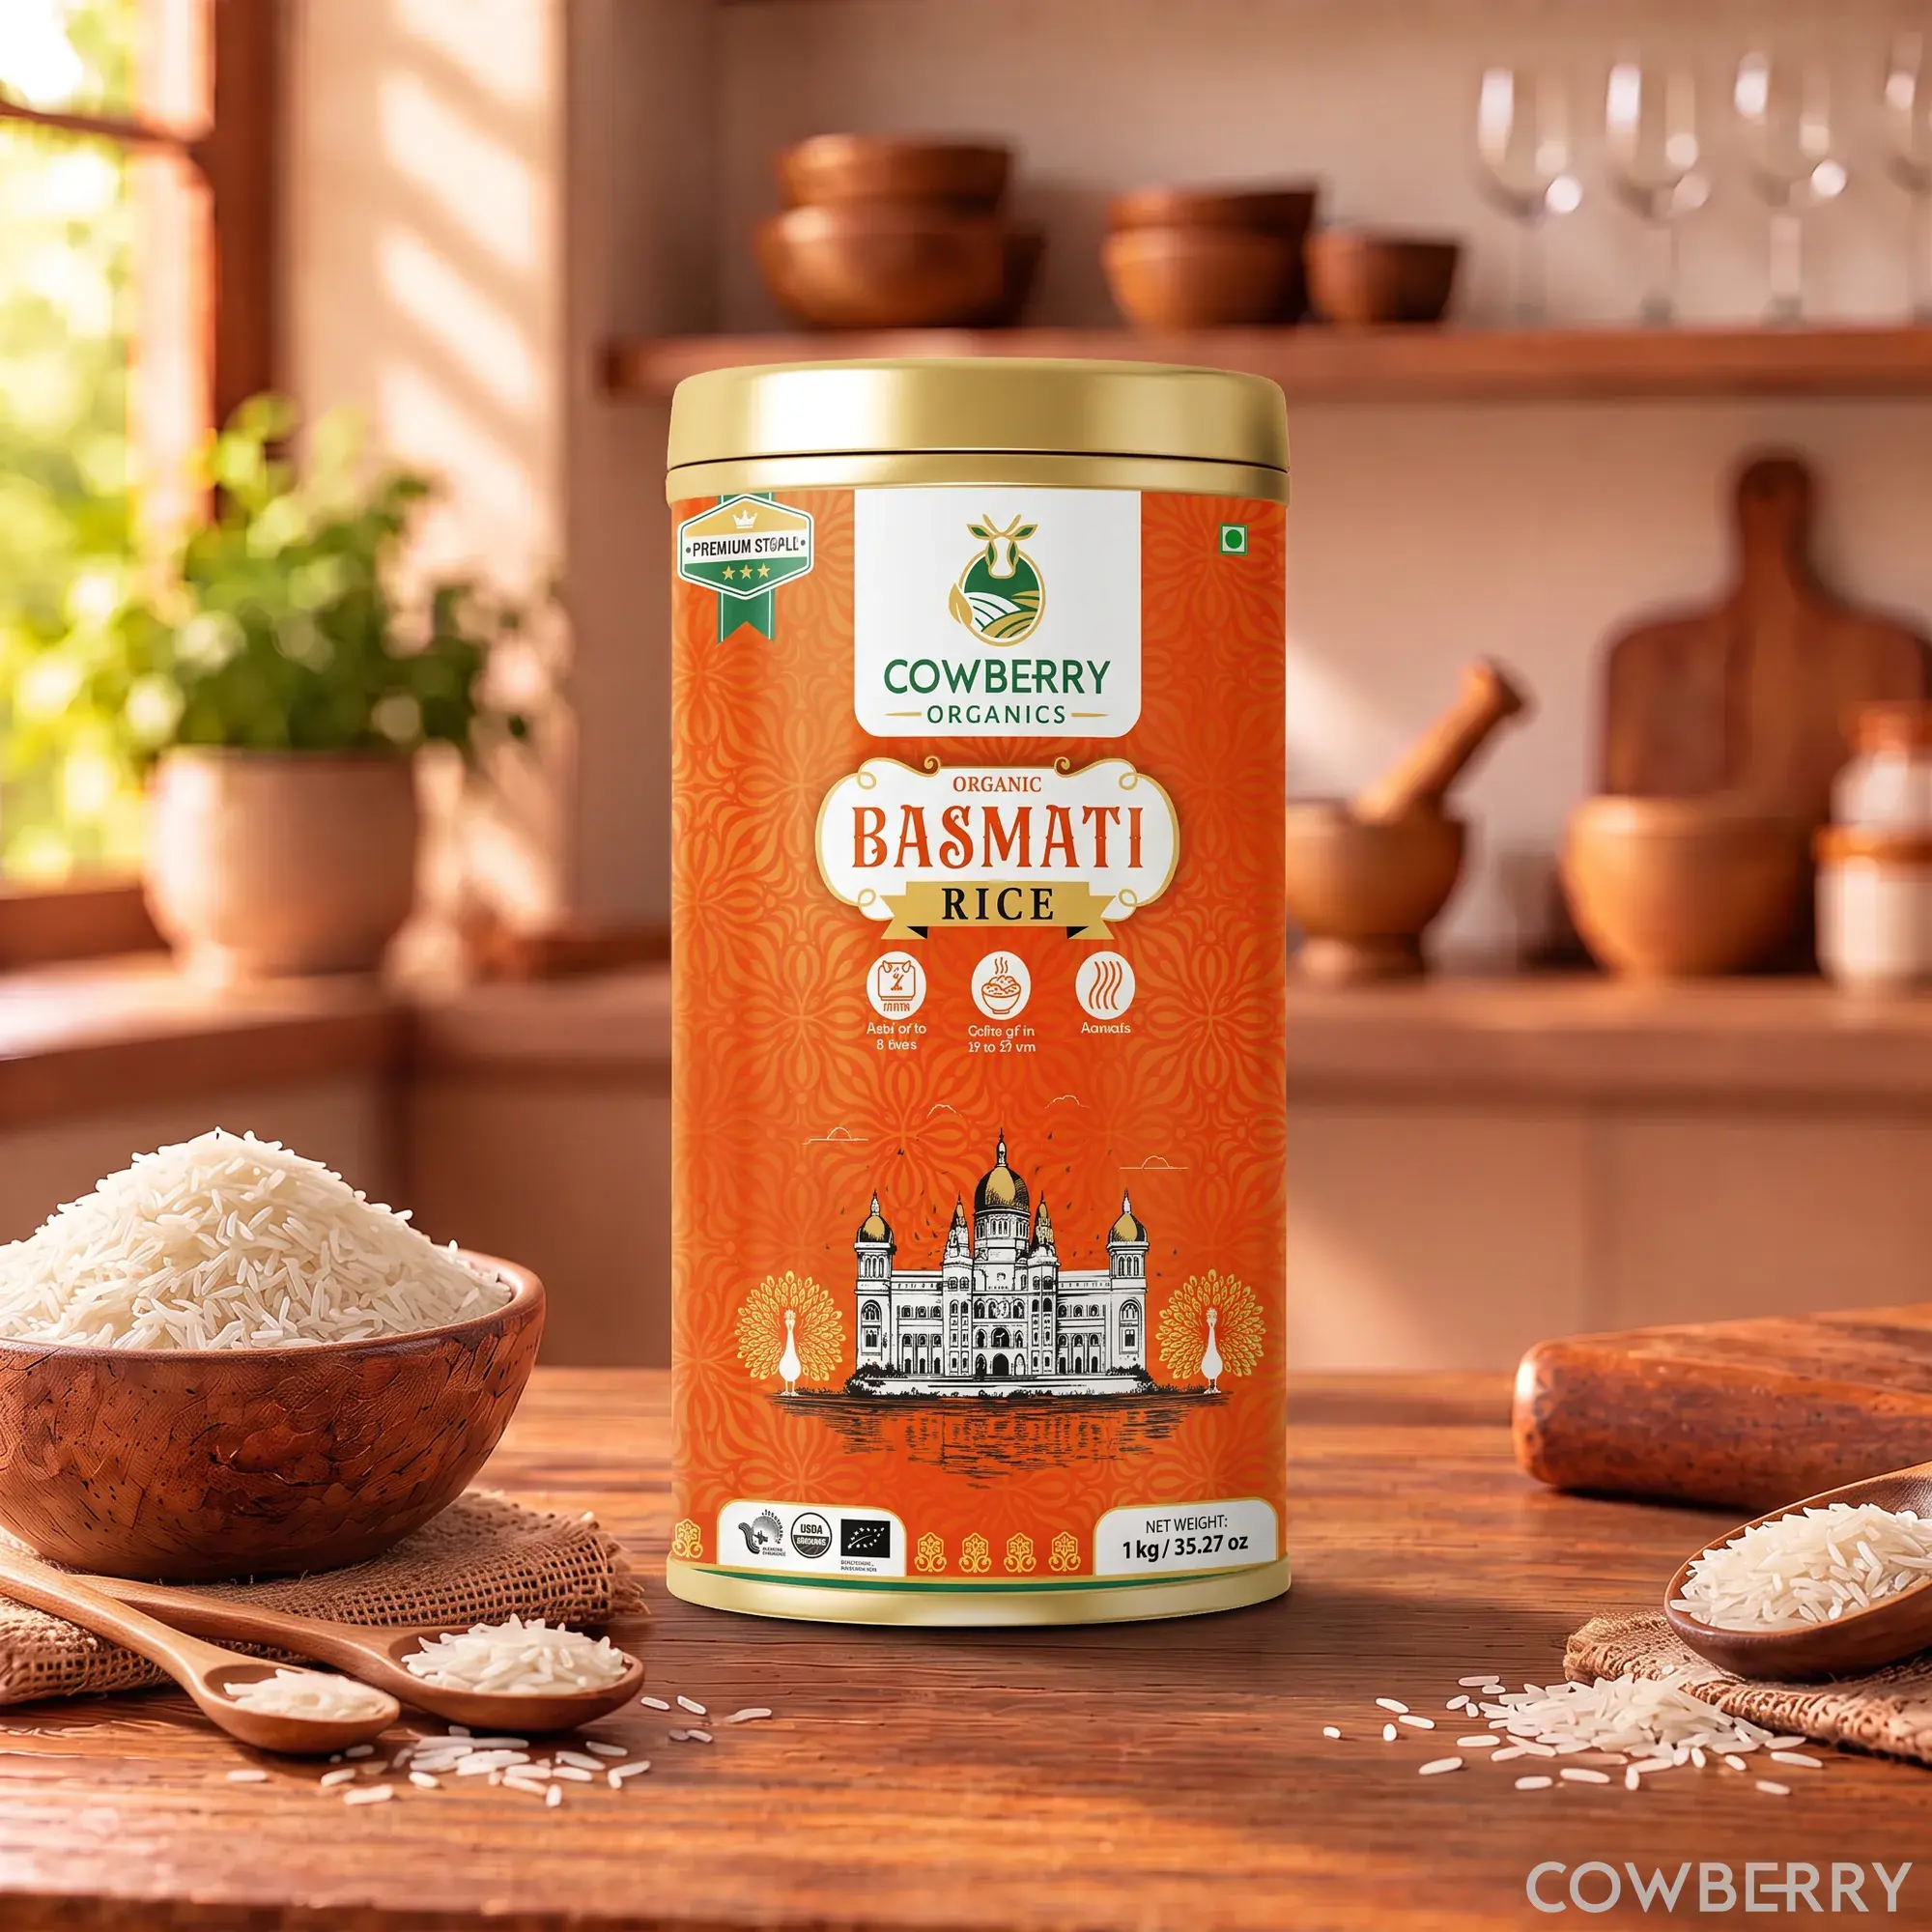
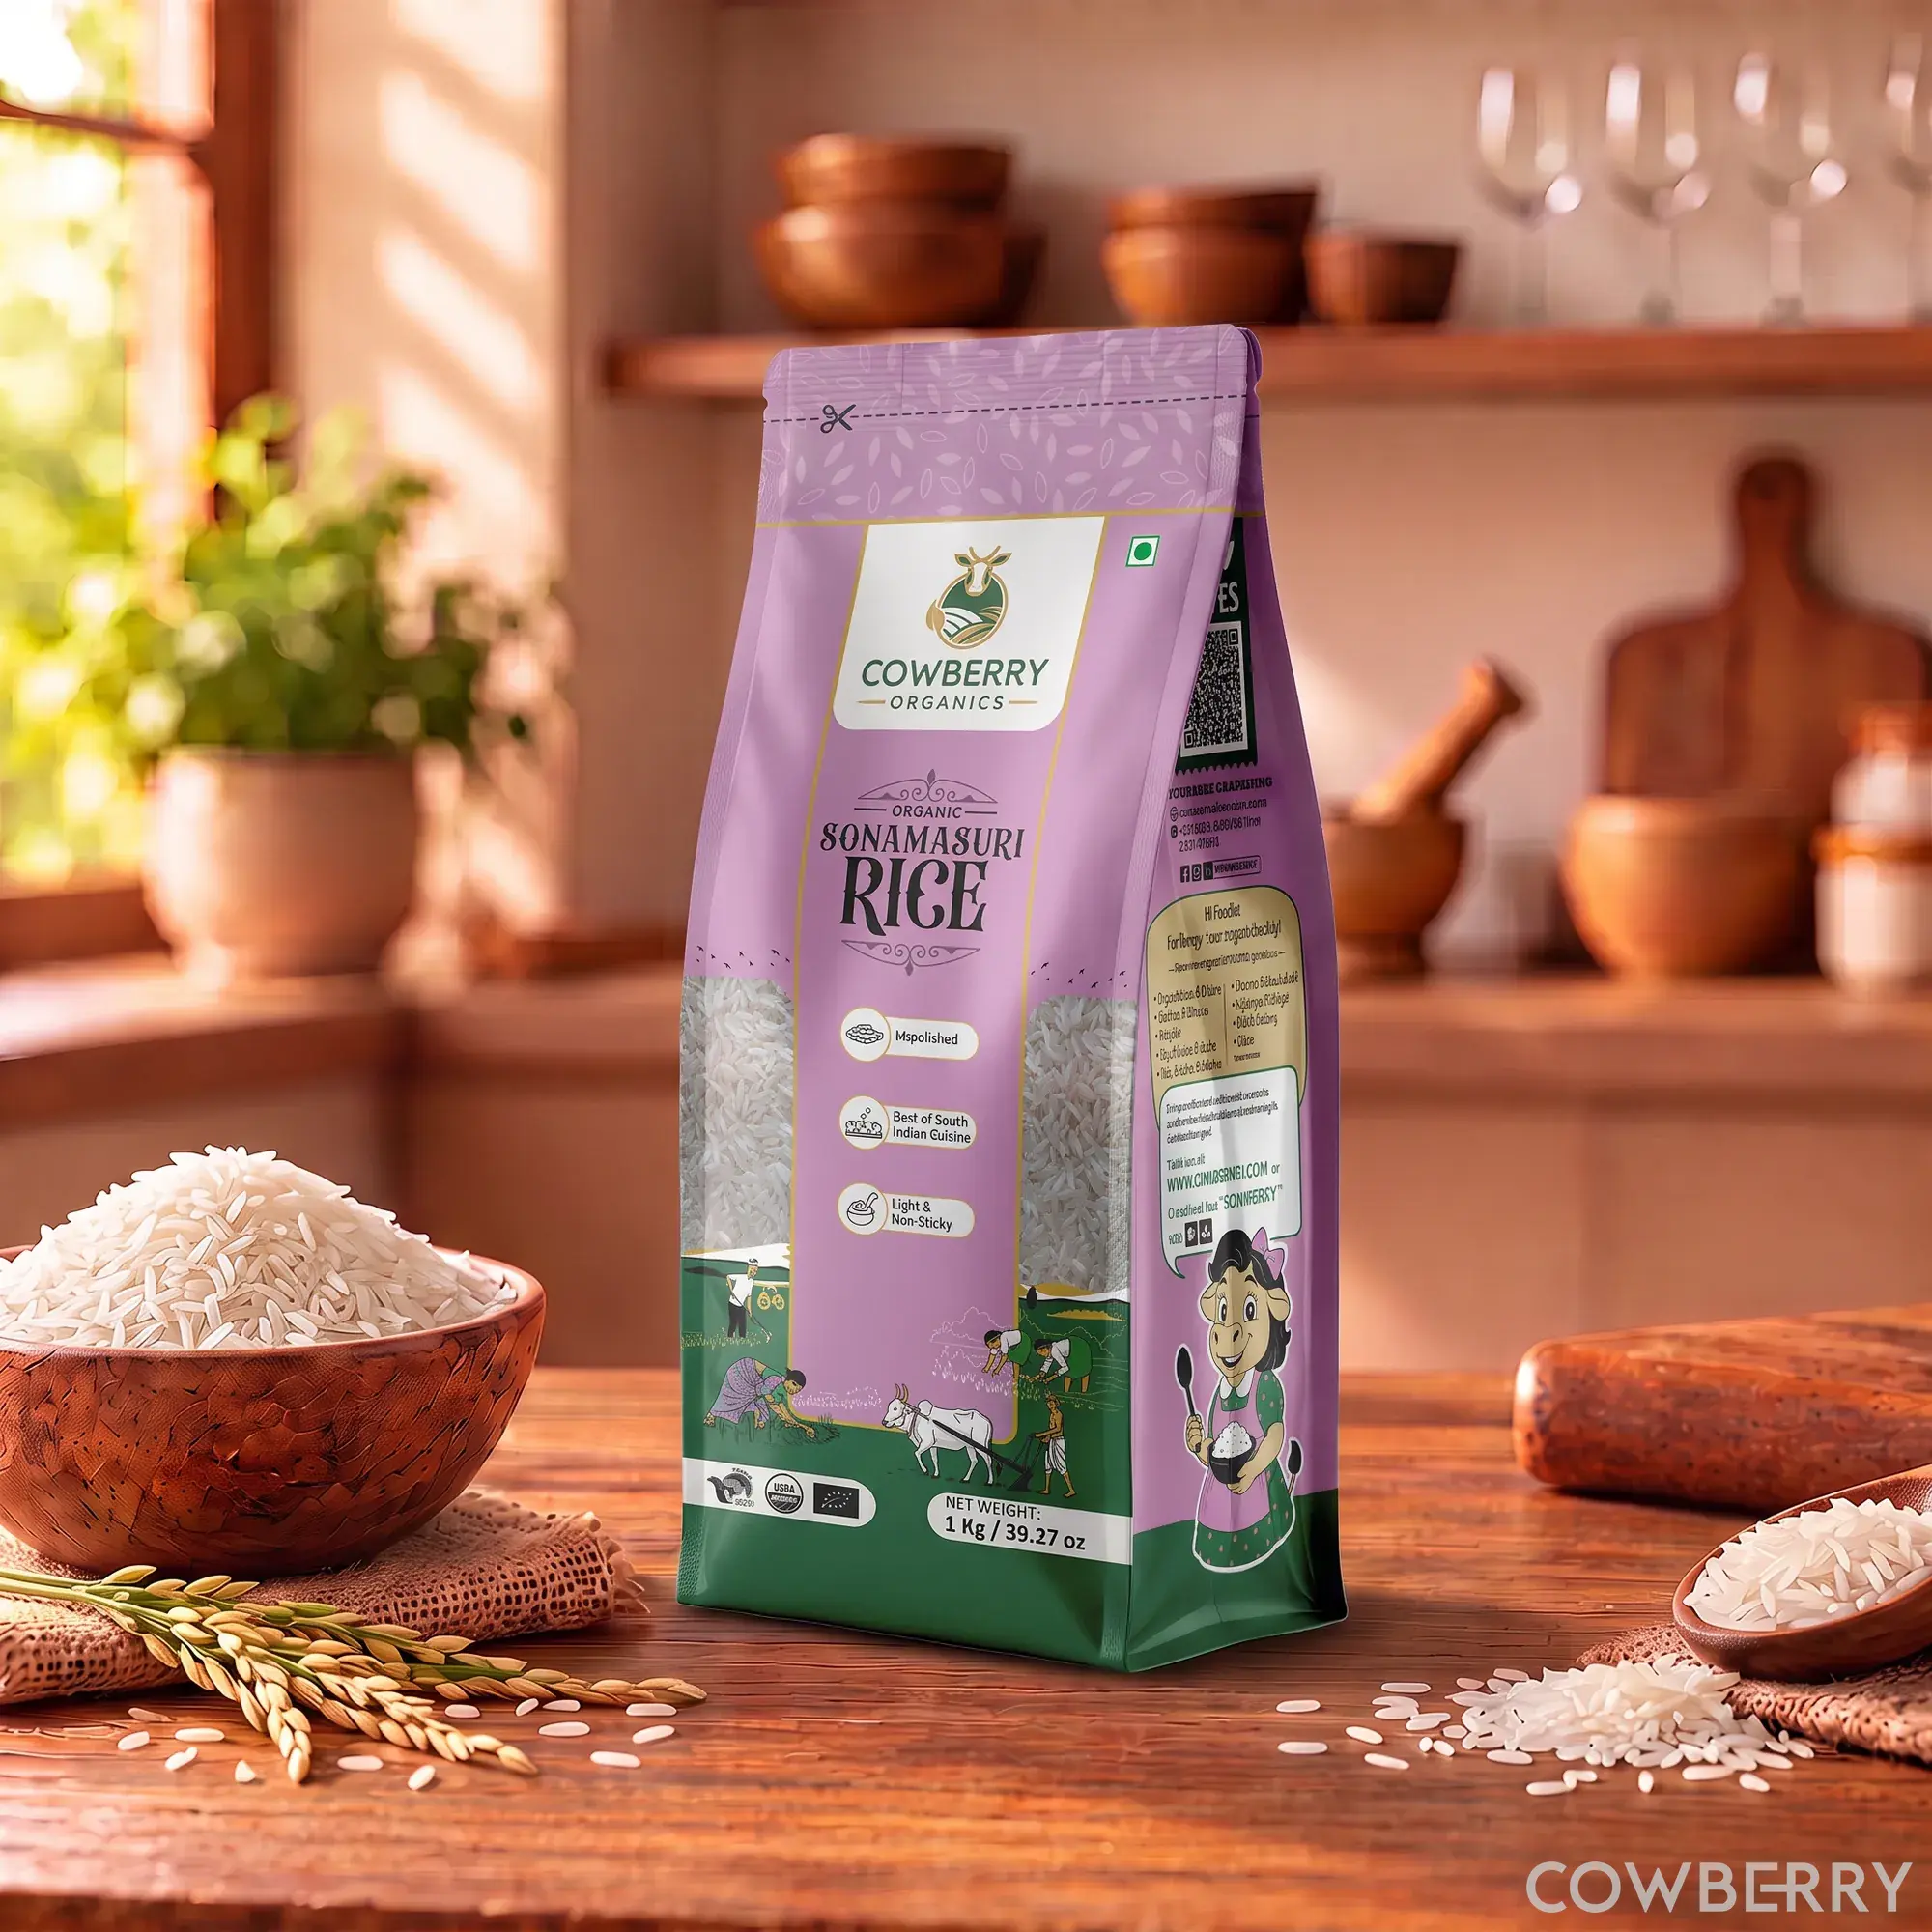
Taste is hard to measure, so this section keeps to what is written down. COWBERRY describes its basmati as long-grain with a delicate aroma and a fluffy texture, ready in about 12 to 15 minutes at a rice-to-water ratio of around 1:1.5; its sona masoori is soft and light and cooks in the same 12 to 15 minutes. For quinoa there is less to go on: the IFCT 2017 values are for the raw grain, and its three GI entries are all plain cooked quinoa. Both grains are boiled staples; beyond that, taste is for the cook to judge. On the rice side the guidelines add one habit: use only enough water and avoid repeated washing.
Quinoa vs rice: cost and where each fits
Cost is where rice keeps its edge, in words rather than numbers: quinoa generally costs more per kilogram than rice in Indian stores, which is why it tends to appear as the occasional swap rather than the daily grain. Where each fits follows from that. Rice fits the everyday plate: dal chawal, curd rice, khichdi, jeera rice and the rest of the rotation. Quinoa fits the high-protein slot: a boiled bowl in place of rice on days when the meal needs more protein and fibre, in salads and khichdi-style bowls. Neither grain is the wrong choice; the right choice is the one the household will actually cook. See our guide to rice (chawal) for the rice side, and jeera rice, curd rice and masala khichdi for the recipes.
Which one for whom: weight loss, diabetes and everyday meals
For weight loss, the katori math is the honest tiebreaker: 40 g of raw quinoa cooks to 132 kcal with 5.2 g of protein and 5.9 g of fibre, while the same 40 g of rice cooks to 143 kcal with 3.2 g of protein and 1.1 g of fibre. Quinoa edges the numbers, rice wins on habit, and the difference is small enough that either grain works inside a calorie deficit. The University of Sydney notes that a low GI pattern is one of the keys to maintaining weight loss, and that a moderately high-protein, low GI diet fared best for longer-term weight management in the Diogenes study it cites. For diabetes, the three grains sit close, at 52, 50 and 58, all in the low-to-medium bands, so portion and pairing do the real work. The chawal for weight loss page does the rice portions in full.
FAQs
Is quinoa better than rice?
It depends on the goal. Per 100 g of raw grain, quinoa carries 13.11 g of protein and 14.66 g of fibre against 7.94 g and 2.81 g in milled white rice, and quinoa's GI of 52 is level with India-tested basmati's 50. Rice wins on everyday cost and kitchen habit; quinoa wins where protein and fibre matter.
Which rice has the lowest glycemic index?
Basmati, at a GI of 50 in the India-tested entry; brown rice follows at 58. Quinoa, for context, averages 52 across three cooked entries tested in Australia, so it is a match rather than an upgrade on this measure. Among dishes, curd rice lists at 65 against plain rice at 78 in the ICMR-NIN annexure.
Is chawal good for weight loss?
Yes, and the quinoa comparison shows why: a katori of rice from 40 g of raw grain is 143 kcal, against 132 kcal for the same weight of quinoa. The gap is 11 kcal, smaller than one teaspoon of oil. Portion, not grain choice, does the work.
How many calories in a plate of dal chawal?
About 242 kcal before any fat, counted raw: one katori of cooked rice from 40 g of raw rice gives about 143 kcal, and one katori of cooked arhar dal from 30 g of dry dal adds about 99 kcal. Ghee or oil in the tadka comes on top of that.
Difference between dal chawal and khichdi?
Dal chawal is cooked dal served beside a bowl of rice, while khichdi cooks the rice and dal together in one pot until soft, usually with more water. Both pair a cereal with a pulse, which the guidelines say improves protein quality at a 3:1 ratio; the totals depend on how much rice and dal go in.
Which rice to eat in diabetes?
Basmati (GI of 50) or brown rice (58), in a measured katori with dal and sabzi; quinoa at 52 is an equal swap, not an upgrade. Studies tie heavier white rice intake to higher diabetes risk and brown rice to lower. Set amounts with your doctor or dietitian.
References
- Indian Food Composition Tables (IFCT) 2017, ICMR-National Institute of Nutrition
- Dietary Guidelines for Indians, ICMR-National Institute of Nutrition
- University of Sydney glycemic index database (GI search)
- University of Sydney: about the glycemic index
- Yu J, Balaji B et al. White rice, brown rice and the risk of type 2 diabetes: a systematic review and meta-analysis. BMJ Open, 2022
Shop this article
Keep reading
Red rice vs brown rice: the fibre, GI and honest verdict
Red rice vs black rice: nutrition, glycemic index and which to choose
Red rice nutrition per 100g: calories, protein, fibre and GI